Track business performance in OmniOrders with real-time metrics, sales trends, and visual analytics. Make data-driven decisions using built-in charts and KPIs.
---
title: "Metrics & Analytics"
description: Track business performance in OmniOrders with real-time metrics, sales trends, and visual analytics. Make data-driven decisions using built-in charts and KPIs.
---
**Metrics & Analytics** gives you a complete view of your business performance. Track sales, monitor order trends, analyze your best-selling products, and understand where your customers are located. All metrics update automatically based on your selected date range and filters.
:::tip[Quick Insight]
Use the date range selector to compare current performance against previous periods. The percentage changes show whether metrics are trending up or down compared to the previous time period.
:::
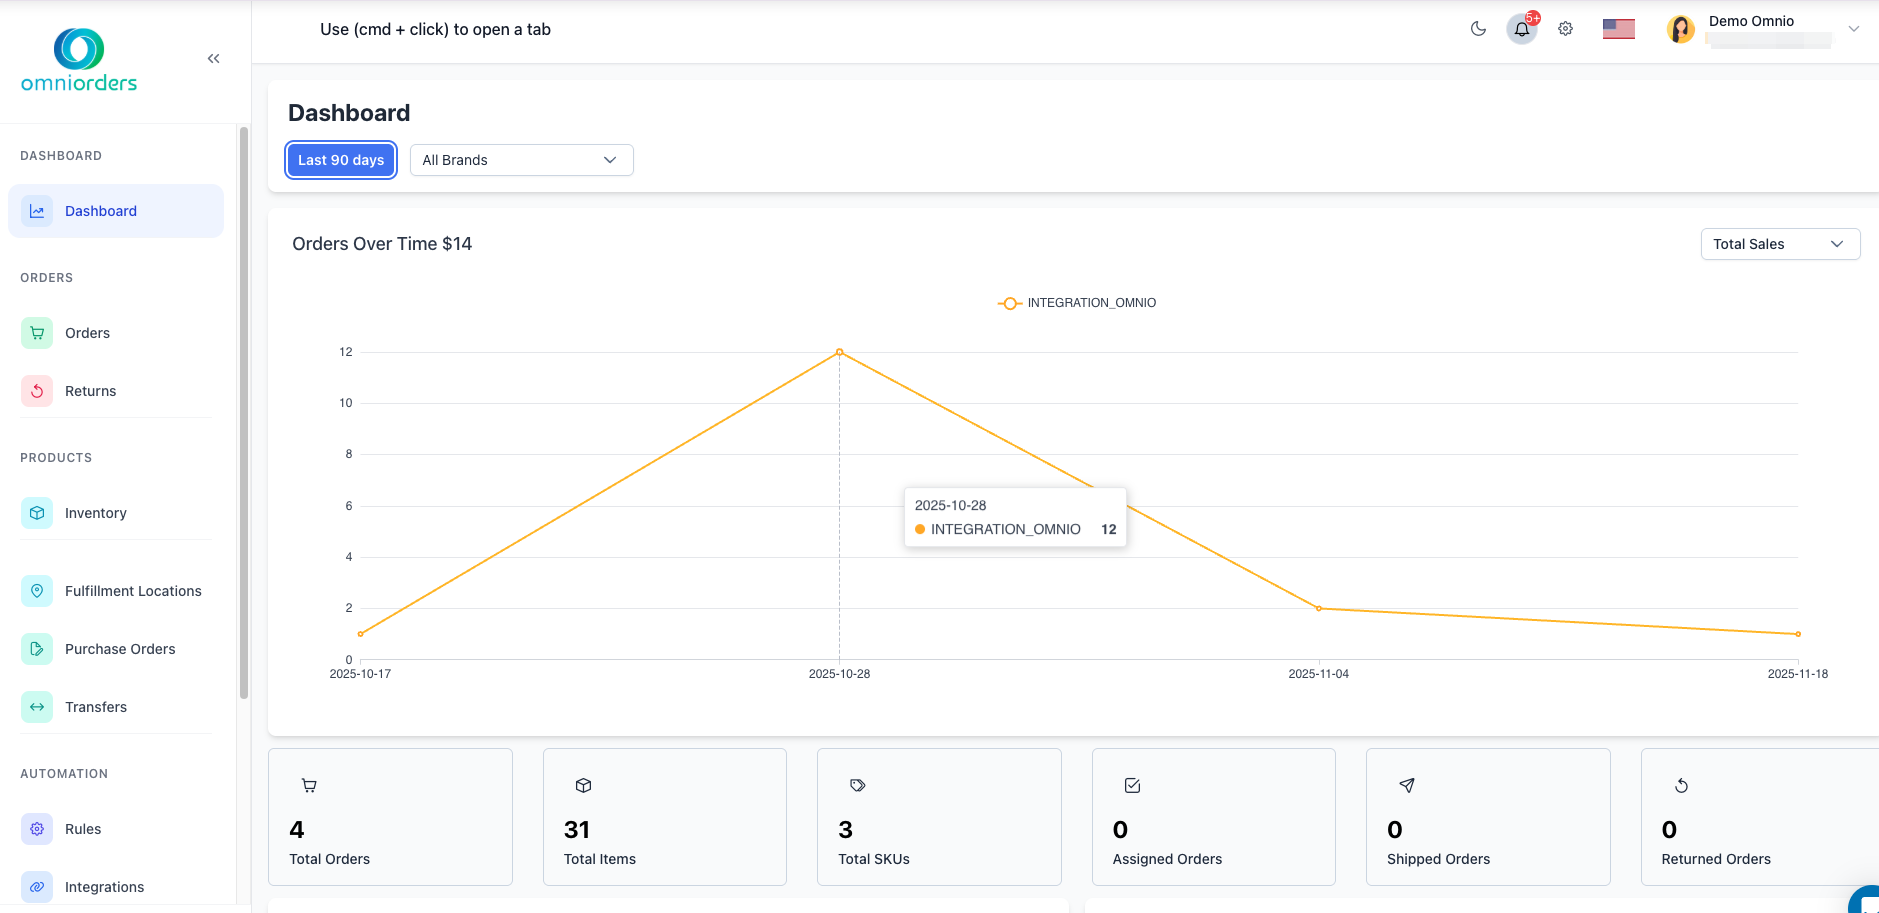
*Dashboard showing the complete metrics layout. When you have order data, all metric cards and charts will populate with real-time analytics.*
---
## 📊 Key Performance Metrics
Your dashboard displays critical business metrics at a glance, with real-time updates and trend indicators.
<SupademoEmbed demoId="cmi6i9kie43pib7b45wcq2wna" />
### Order Metrics
<CardGrid>
<IconCard title="Total Orders" icon="shopping-cart">
See the total number of orders received during the selected time period. The percentage shows
the increase or decrease compared to the previous period.
</IconCard>
<IconCard title="Total Items" icon="box">
Track the total number of items sold across all orders. This helps you understand order volume
and fulfillment workload.
</IconCard>
<IconCard title="Total SKUs" icon="tags">
View the count of unique products sold during the period. Higher SKU diversity often indicates
a broader product appeal.
</IconCard>
</CardGrid>
### Order Status Metrics
<CardGrid>
<IconCard title="Assigned Orders" icon="check-square">
Orders that have been assigned to a fulfillment location and are ready for processing. This
metric shows your order pipeline health.
</IconCard>
<IconCard title="Shipped Orders" icon="send">
Orders that have been successfully shipped to customers. Track your fulfillment completion
rate with this metric.
</IconCard>
<IconCard title="Returned Orders" icon="rotate-ccw">
Orders that have been returned by customers. Monitor return rates to identify potential
product or service issues.
</IconCard>
</CardGrid>
### Sales Metrics
<CardGrid>
<IconCard title="Total Sales" icon="dollar-sign">
Your total revenue for the selected period. The percentage change helps you track revenue
growth or decline compared to the previous period.
</IconCard>
<IconCard title="Average Order Value" icon="chart-line">
The average dollar amount per order (Total Sales ÷ Total Orders). Increasing this metric
means customers are spending more per purchase.
</IconCard>
<IconCard title="Average Item Cost" icon="wallet">
The average price per item sold (Total Sales ÷ Total Items). Use this to understand your
product pricing effectiveness.
</IconCard>
<IconCard title="Average Items per Order" icon="list">
The average number of items in each order (Total Items ÷ Total Orders). Higher numbers
indicate customers are buying multiple items per transaction.
</IconCard>
</CardGrid>
:::note[Understanding Percentages]
The percentage indicators show how each metric compares to the previous period of equal length. Green arrows (↑) indicate improvement, while red arrows (↓) show a decrease. If there's no previous data to compare, the percentage won't appear.
:::
---
## 📅 Filtering Your Data
Control which data appears in your metrics and charts using the date range and brand filters.
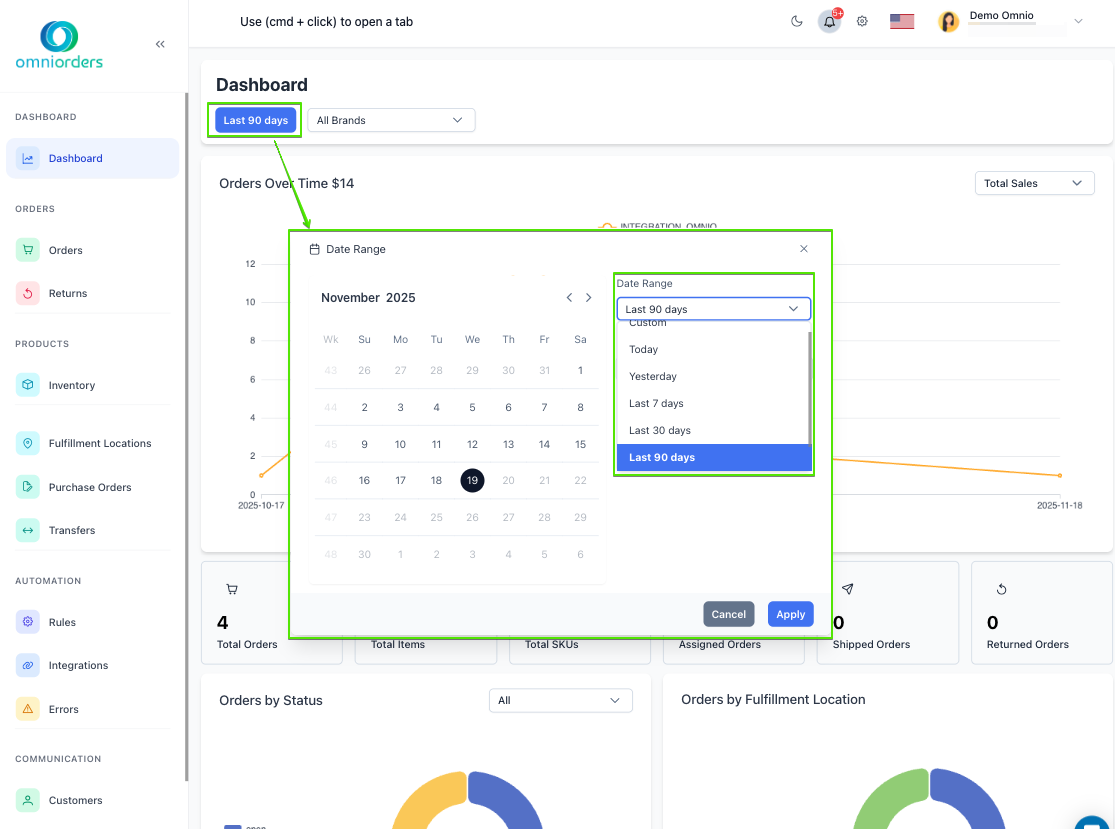
*Date range selection dialog with calendar and preset options.*
<Steps>
1. **Select a Date Range**
Click the date range button at the top of the dashboard to choose your time period:
- **Today** - Shows today's data only
- **Yesterday** - Shows yesterday's complete data
- **Last 7 Days** - The past week including today (default)
- **Last 30 Days** - The past month including today
- **Last 90 Days** - The past quarter including today
- **Last Month** - The complete previous calendar month
- **Custom Date Range** - Pick any start and end date
</Steps>
<SupademoEmbed demoId="cmi6gvb804112b7b4d4ypmrhd" />
<Steps>
2. **Choose Custom Dates (Optional)**
For custom date ranges, a calendar dialog appears:
- Select your start date and end date on the calendar
- Or use the date input fields to type specific dates
- Click **Apply** to update all metrics and charts
- The date range can go back up to 2 years
</Steps>
<SupademoEmbed demoId="cmi6hfett41sxb7b4btp9cni9" />
<Steps>
3. **Filter by Brand (Optional)**
Use the brand dropdown to focus on specific product brands:
- Select **All Brands** to see everything (default)
- Choose a specific brand to see only orders containing that brand's products
- All metrics and charts update automatically when you change brands
</Steps>
<SupademoEmbed demoId="cmi6hmd0t426vb7b4tbgyvknl" />
:::caution[Date Range Limits]
You can select any date range within the past 2 years. Data older than 2 years is not available in the dashboard view.
:::
---
## 📈 Orders Over Time Chart
This line chart shows your order volume or sales trends over the selected date range, broken down by sales channel.
### Using the Chart
- **Toggle Between Views**: Use the dropdown in the chart header to switch between "Total Sales" (revenue) and "Total Orders" (order count)
- **View by Channel**: Each colored line represents a different sales channel (Shopify, Amazon, eBay, etc.)
- **Click to Drill Down**: Click any point on the chart to navigate to the Orders page filtered by that specific channel and date
- **Hover for Details**: Move your mouse over the chart to see exact numbers for each date and channel
:::tip[Spotting Trends]
Look for consistent upward slopes to identify growth periods, or sudden spikes that might indicate successful promotions or seasonal demand.
:::
---
## 🥧 Orders by Status Chart
This pie chart shows the distribution of your orders across different fulfillment statuses.
### Chart Features
- **Visual Breakdown**: Each slice represents a different order status (New, Assigned, Shipped, etc.)
- **Filter by Location**: Use the fulfillment location dropdown above the chart to focus on a specific warehouse
- **Click to Filter**: Click any status slice to navigate to the Orders page filtered by that status
- **View Percentages**: Hover over any slice to see the exact count and percentage of total orders
**Common Statuses:**
- **New**: Orders that just arrived and haven't been assigned yet
- **Assigned**: Orders assigned to a fulfillment location
- **Shipped**: Orders that have been sent to customers
- **Delivered**: Orders successfully received by customers
- **Returned**: Orders sent back by customers
:::note[Small Slices]
Status categories representing less than 3% of total orders are grouped into an "Other" slice to keep the chart readable. Click "Other" to see all grouped statuses.
:::
---
## 📍 Orders by Fulfillment Location Chart
This pie chart displays how your orders are distributed across your fulfillment locations (warehouses).
### Understanding the Chart
- **Location Distribution**: Each slice represents a different fulfillment location
- **Click to Filter**: Click any location slice to view orders for that specific warehouse
- **Compare Volumes**: Quickly see which locations handle the most orders
- **Hover for Details**: See exact order counts and percentages for each location
:::tip[Balancing Workloads]
If one location shows significantly higher volume than others, consider whether inventory distribution or routing rules need adjustment.
:::
---
## 🏆 Top SKUs Chart
This horizontal bar chart shows your 5 best-selling products, broken down by sales channel.
### Chart Details
- **Top 5 Products**: Displays the SKUs with the highest sales during your selected time period
- **Stacked by Channel**: Each bar is divided into colored segments representing different sales channels
- **Click to View Details**: Click any bar to navigate to the Inventory page for that specific SKU
- **Compare Across Channels**: See which products perform best on each platform
**How It's Calculated:**
- Products are ranked by total quantity sold across all channels
- Only the top 5 products are shown
- Data updates automatically when you change your date range or brand filter
:::note[Channel Performance]
If a product sells well on one channel but not others, consider adjusting your marketing or inventory distribution strategies.
:::
---
## 🗺️ Geographic Distribution Charts
Two geographic charts show where your orders are coming from: one for the United States and one for worldwide orders.
### Orders by State (USA)
View your order distribution across U.S. states in two formats:
- **Map View**: An interactive map where darker colors indicate higher order volumes
- **Bar Chart View**: A horizontal bar chart showing exact order counts per state
- **Toggle Views**: Use the dropdown in the chart header to switch between Map and Bar views
### Orders by Country (Global)
See your international order distribution:
- **World Map View**: A global map showing order density by country
- **Bar Chart View**: A sorted bar chart of countries by order volume
- **Toggle Views**: Switch between visualizations using the dropdown menu
### Using Geographic Charts
- **Hover for Details**: Move your mouse over any region to see the order count
- **Identify Markets**: Quickly spot your strongest geographic markets
- **Plan Expansion**: Use low-volume regions to identify growth opportunities
:::tip[Market Insights]
Use geographic data to inform decisions about:
- Where to establish new fulfillment centers
- Which regions need targeted marketing
- International shipping strategy priorities
:::
---
## 🔄 How Metrics Update
Your dashboard metrics and charts update automatically based on your selections:
<CardGrid>
<IconCard title="Auto-Refresh" icon="refresh-cw">
**Real-Time Updates**: Metrics refresh automatically when new orders arrive, ensuring you
always see current data without manually reloading.
</IconCard>
<IconCard title="Filter Impact" icon="filter">
**Instant Filtering**: When you change date ranges or brand filters, all metrics and charts
update immediately to reflect your selections.
</IconCard>
<IconCard title="Comparison Periods" icon="trending-up">
**Previous Period Comparison**: Percentage changes compare your selected period to an equally
long previous period automatically.
</IconCard>
</CardGrid>
---
## 💡 Best Practices
<CardGrid>
<IconCard title="Regular Check-Ins" icon="calendar">
**Daily Monitoring**: Review your dashboard each morning to check overnight orders, identify
any urgent issues, and plan your day's priorities.
</IconCard>
<IconCard title="Trend Analysis" icon="line-chart">
**Weekly Comparisons**: Use 7-day periods to identify week-over-week trends. Compare against
the same period last year to account for seasonal variations.
</IconCard>
<IconCard title="Performance Goals" icon="target">
**Set Benchmarks**: Track metrics like Average Order Value and watch for improvements over
time. Use data to set realistic growth targets.
</IconCard>
<IconCard title="Issue Detection" icon="alert-triangle">
**Watch for Changes**: Sudden drops in orders or spikes in returns can indicate problems
that need immediate attention.
</IconCard>
</CardGrid>
---
## 🎯 Common Use Cases
### Evaluating Sales Performance
<Steps>
1. Set your date range to "Last 30 Days"
2. Review Total Sales and compare the percentage to the previous month
3. Check Average Order Value to see if customers are spending more
4. Look at the Orders Over Time chart to identify peak sales days
</Steps>
### Analyzing Product Performance
<Steps>
1. Check the Top SKUs chart to see your best sellers
2. Click on individual SKU bars to view inventory and stock levels
3. Compare performance across different sales channels
4. Adjust inventory orders based on demand patterns
</Steps>
### Monitoring Fulfillment Health
<Steps>
1. Review the Orders by Status chart to check order flow
2. Ensure Assigned and Shipped orders are progressing normally
3. Check the Orders by Fulfillment Location chart for workload balance
4. Investigate any abnormal status distributions
</Steps>
### Understanding Customer Geography
<Steps>
1. Review Orders by State and Orders by Country charts
2. Identify your strongest regional markets
3. Look for unexpected demand in new locations
4. Use insights to plan fulfillment center locations or shipping strategies
</Steps>
---
## ❓ Frequently Asked Questions
<CardGrid>
<IconCard title="Why are percentages not showing?" icon="help-circle">
Percentages require previous period data for comparison. If you're viewing data from when you
first started using OmniOrders, there may not be earlier data to compare against.
</IconCard>
<IconCard title="How do I export analytics data?" icon="download">
While the dashboard provides visual analytics, you can export detailed order data from the
Orders page. Navigate to **Orders** > **Export CSV** to download raw data for your own analysis.
</IconCard>
<IconCard title="Can I customize which metrics appear?" icon="settings">
The dashboard shows standard metrics for all users. For custom reporting, use the Reports
section or export data for analysis in external tools like Excel or Google Sheets.
</IconCard>
<IconCard title="Why don't my totals match other reports?" icon="alert-circle">
Different date ranges, time zones, or filters can cause variations. Ensure you're comparing
the same time periods and using the same filters across all reports.
</IconCard>
</CardGrid>
---
**Next Steps:** Learn about [Dashboard Overview](/dashboard/overview/) to understand all dashboard features, or explore [Orders Overview](/orders/overview/) to manage your order workflows.