Total Orders
See the total number of orders received during the selected time period. The percentage shows the increase or decrease compared to the previous period.
Metrics & Analytics gives you a complete view of your business performance. Track sales, monitor order trends, analyze your best-selling products, and understand where your customers are located. All metrics update automatically based on your selected date range and filters.
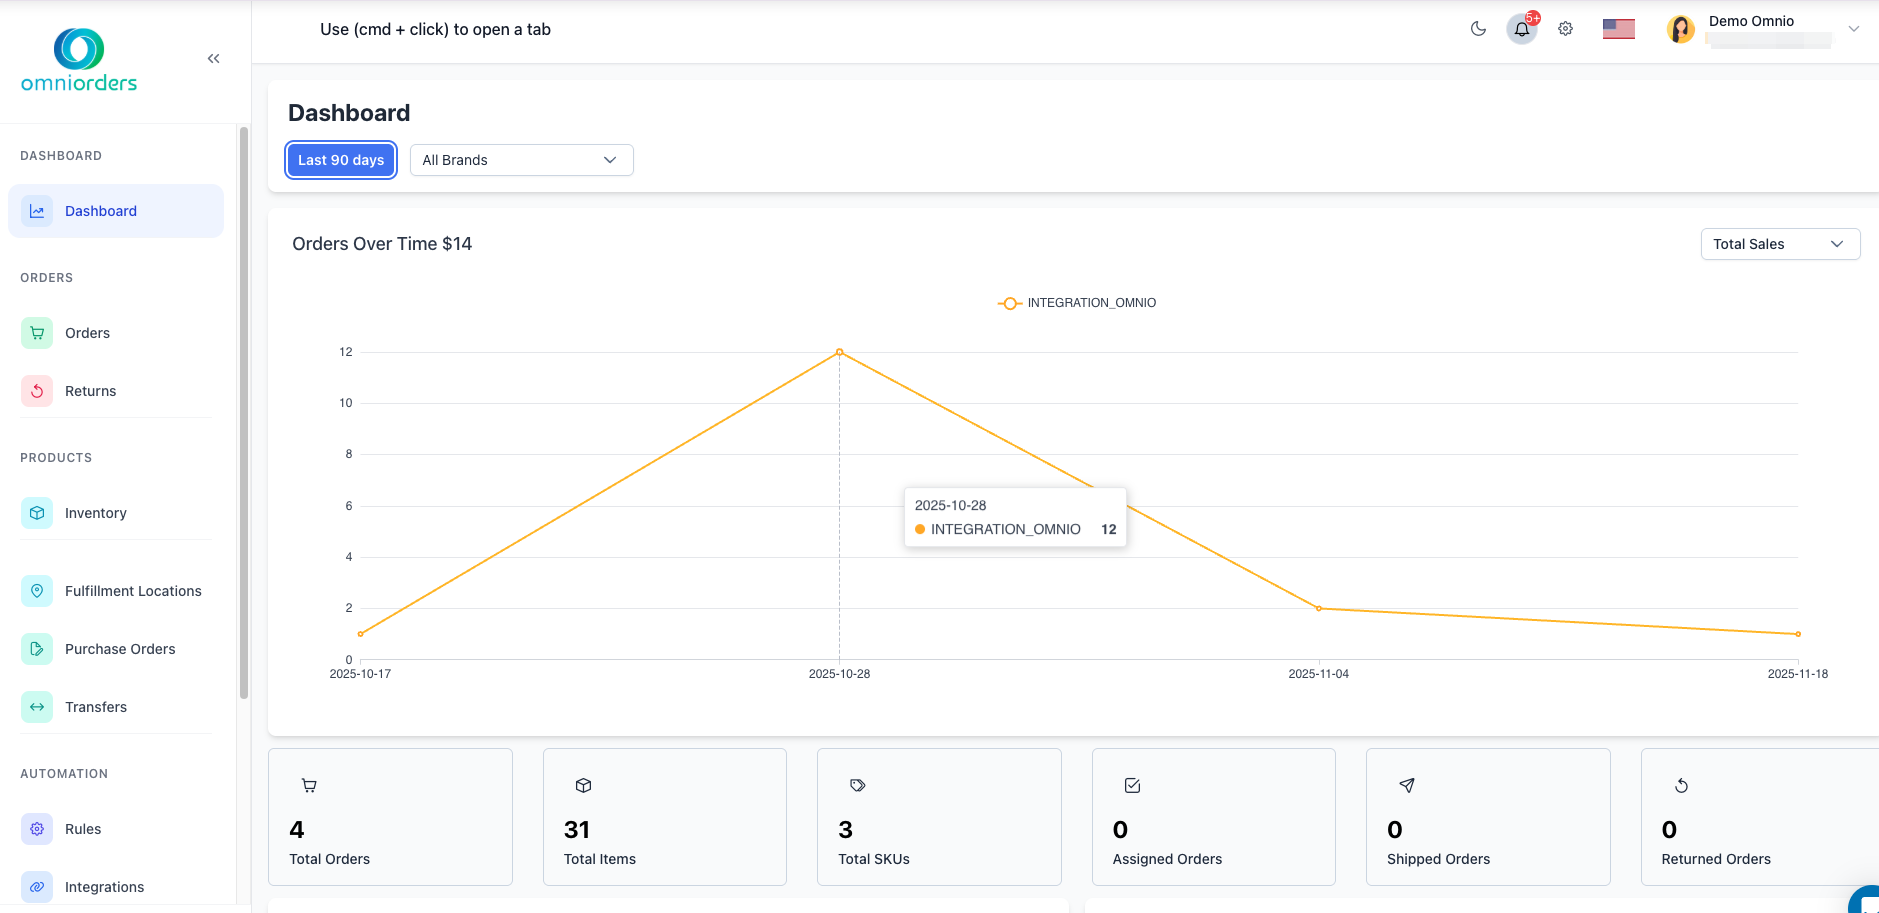 Dashboard showing the complete metrics layout. When you have order data, all metric cards and charts will populate with real-time analytics.
Your dashboard displays critical business metrics at a glance, with real-time updates and trend indicators.
See the total number of orders received during the selected time period. The percentage shows the increase or decrease compared to the previous period.
Track the total number of items sold across all orders. This helps you understand order volume and fulfillment workload.
View the count of unique products sold during the period. Higher SKU diversity often indicates a broader product appeal.
Orders that have been assigned to a fulfillment location and are ready for processing. This metric shows your order pipeline health.
Orders that have been successfully shipped to customers. Track your fulfillment completion rate with this metric.
Orders that have been returned by customers. Monitor return rates to identify potential product or service issues.
Your total revenue for the selected period. The percentage change helps you track revenue growth or decline compared to the previous period.
The average dollar amount per order (Total Sales ÷ Total Orders). Increasing this metric means customers are spending more per purchase.
The average price per item sold (Total Sales ÷ Total Items). Use this to understand your product pricing effectiveness.
The average number of items in each order (Total Items ÷ Total Orders). Higher numbers indicate customers are buying multiple items per transaction.
Control which data appears in your metrics and charts using the date range and brand filters.
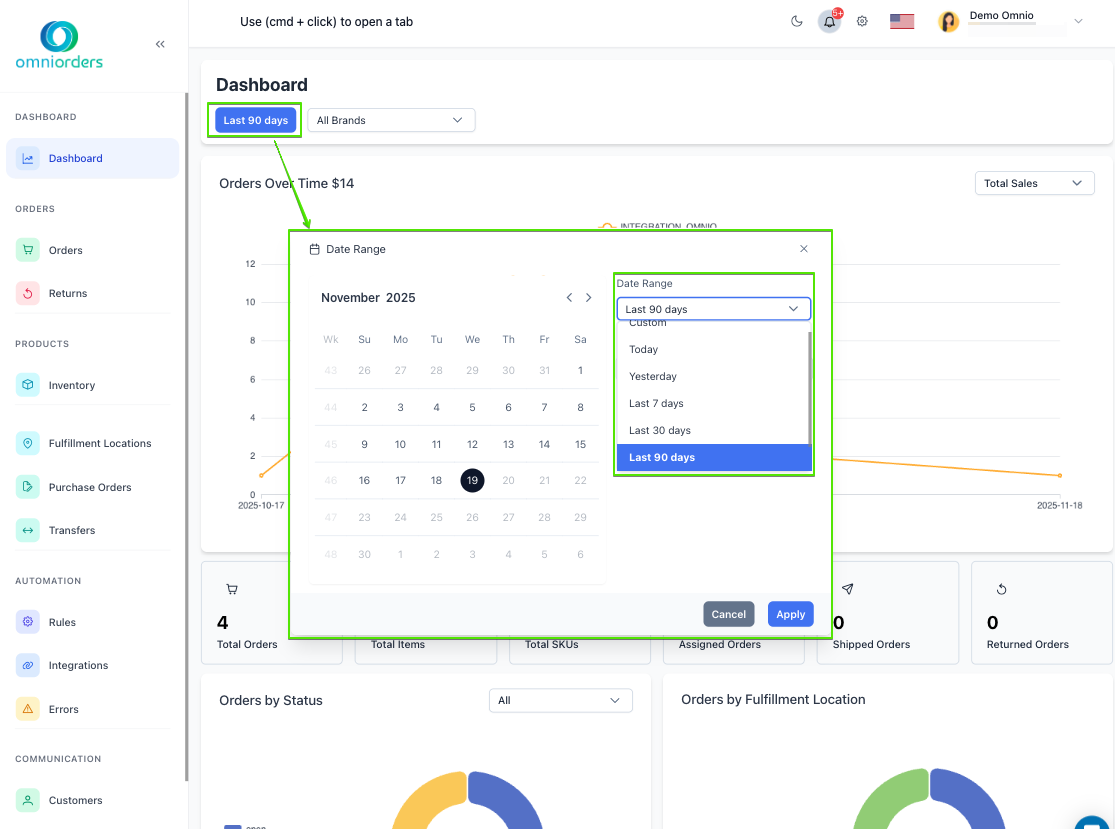 Date range selection dialog with calendar and preset options.
Select a Date Range
Click the date range button at the top of the dashboard to choose your time period:
Choose Custom Dates (Optional)
For custom date ranges, a calendar dialog appears:
Filter by Brand (Optional)
Use the brand dropdown to focus on specific product brands:
This line chart shows your order volume or sales trends over the selected date range, broken down by sales channel.
This pie chart shows the distribution of your orders across different fulfillment statuses.
Common Statuses:
This pie chart displays how your orders are distributed across your fulfillment locations (warehouses).
This horizontal bar chart shows your 5 best-selling products, broken down by sales channel.
How It’s Calculated:
Two geographic charts show where your orders are coming from: one for the United States and one for worldwide orders.
View your order distribution across U.S. states in two formats:
See your international order distribution:
Your dashboard metrics and charts update automatically based on your selections:
Real-Time Updates: Metrics refresh automatically when new orders arrive, ensuring you always see current data without manually reloading.
Instant Filtering: When you change date ranges or brand filters, all metrics and charts update immediately to reflect your selections.
Previous Period Comparison: Percentage changes compare your selected period to an equally long previous period automatically.
Daily Monitoring: Review your dashboard each morning to check overnight orders, identify any urgent issues, and plan your day’s priorities.
Weekly Comparisons: Use 7-day periods to identify week-over-week trends. Compare against the same period last year to account for seasonal variations.
Set Benchmarks: Track metrics like Average Order Value and watch for improvements over time. Use data to set realistic growth targets.
Watch for Changes: Sudden drops in orders or spikes in returns can indicate problems that need immediate attention.
Percentages require previous period data for comparison. If you’re viewing data from when you first started using OmniOrders, there may not be earlier data to compare against.
While the dashboard provides visual analytics, you can export detailed order data from the Orders page. Navigate to Orders > Export CSV to download raw data for your own analysis.
The dashboard shows standard metrics for all users. For custom reporting, use the Reports section or export data for analysis in external tools like Excel or Google Sheets.
Different date ranges, time zones, or filters can cause variations. Ensure you’re comparing the same time periods and using the same filters across all reports.
Next Steps: Learn about Dashboard Overview to understand all dashboard features, or explore Orders Overview to manage your order workflows.